Continuous Contracts Explained
The Concept
Let's
begin with a futures market - Soybean Oil, or Soyoil for short - and say
that there is no such thing as a continuous series of Soyoil futures
prices. Futures markets are comprised of individual contracts, each with a
pre-determined life-span. At any stage, the market consists of a
number of contracts, or "delivery months", that have expiry dates
stretching out into the future. As one contract expires, another is listed for trading, and so the cycle
continues. The only way that a long-term continuous
history of Soyoil prices can be examined is to access a record of cash
market prices. Of course, it's always possible to
"splice" the individual Soyoil futures contracts together in
some way, so as to represent their history. But it must be borne in
mind that the result will merely be a representation of that
history, or a computation, that is handled by a particular
algorithm.
Splicing contracts together
If
all delivery months in the Soyoil cycle were "equal", it would
make sense to splice them together by a very simple algorithm: "when
one contract expires, begin to display the next". This type of series
is called a "spot-month continuous". But delivery
months, particularly in commodity futures markets, are generally not
equal. The delivery months that the Chicago Board of Trade offers for
Soyoil trading are intended to cover the underlying agricultural cycle so
as to give industry participants full scope to hedge their specific needs.
They are not spread equally through the calendar year. For instance, there
is a sequence of contracts expiring in July, August, September and October
and then a jump to December. A hedger may not be interested in the
August, September and October contracts at all, and may prefer to trade in
the December contract well before any of the intervening contracts have expired.
Trading volume tends to be spread unequally between different delivery
months. Sometimes an exchange introduces a new delivery month into a
market cycle and the
industry completely ignores it. The same disinterest may be shown by
a speculator. He may have his own reasons for trading December Soyoil
"early" in the cycle. For instance, he may be discouraged by the
necessity of "rolling" through all of the intervening
contracts, incurring commission costs and potential "slippage"
each time. If the trading volume is sufficient to allow it, why not just
jump straight into December? The "spot-month"
continuous contract - how useful is it? It is often assumed
that a continuous contract has to display the "spot month" at
all times in order to be "correct". This is not the case. A
continuous contract is a representation and that representation is correct
only in so far as it is useful. There is no single "correct"
way to compute a continuous contract for any futures market. The
"spot month" representation is probably the most popular, but
not necessarily the most useful. To understand why,
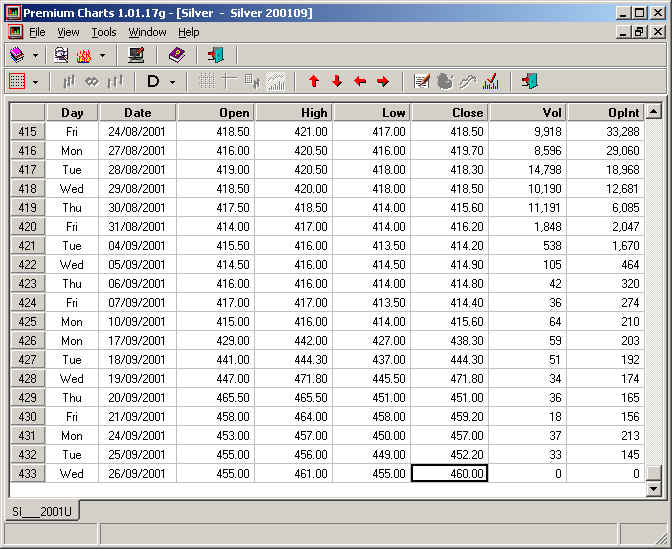
let's consider Silver. An examination of the trading volumes in Silver
futures reveals a marked decline from about a month before the expiry of
each delivery month (see table below). This decline coincides with First Notice Day. If a
trader remains in a contract after First Notice Day, he is at risk of
having to take delivery of the underlying commodity. A Silver
contract still has a month to run after First Notice Day, but very soon
only a handful of industry participants will be trading it. Is there any
use in incorporating the last month of Silver prices into a
continuous contract if that portion of the delivery month will never be
traded? There might be, if no other prices were available, but current prices are
always available from any of the subsequent delivery months. It might be argued that the
spot month prices are the most
important from an "overall analysis point of view". This
argument amounts to saying the following: "My next trade will be in
October Cotton. But I shan't look at prices from the October contract,
even though I am able to. I shall continue to study July prices, because
July is the spot month, and it still has a fortnight to run." This
argument becomes especially curious when it is considered that the July
and October Cotton contracts virtually cover different crops! Rolling on
Volume and/or Open Interest Another simple algorithm for
constructing continuous contracts is to follow the market's lead.
When volume and/or open interest become larger in a back-month, the series
leaves the current contract and moves to the back-month. On the face of
it, this is a clever algorithm, as it automatically circumvents
liquidity problems. It may also surmount the Notice Day problem, by
assuming that trading volume always leaves the current contract in time. The
trouble with the algorithm is its over-riding assumption - that liquidity
is the only appropriate criterion for selecting delivery months. Let's consider
the Eurodollar contract, which is one of the most heavily traded in the
world. There is reasonable volume in at least the first 12 listed
quarterly contracts. Furthermore, there
will often be little difference between the nearby quarterly contract and the
next one out in terms of volume - the volume and open interest will be huge in each. This
invites an obvious question: if the contract with the greatest volume is
the "correct" one to be following, why is there so much interest
in the others? The answer is that different delivery months offer
different trading opportunities, both for hedgers and speculators. The
Eurodollar futures market attempts to predict the level of interest rates
on Eurodollar deposits at specific times into the future. The closer
that the time is to "now", the more sensitive the market is to
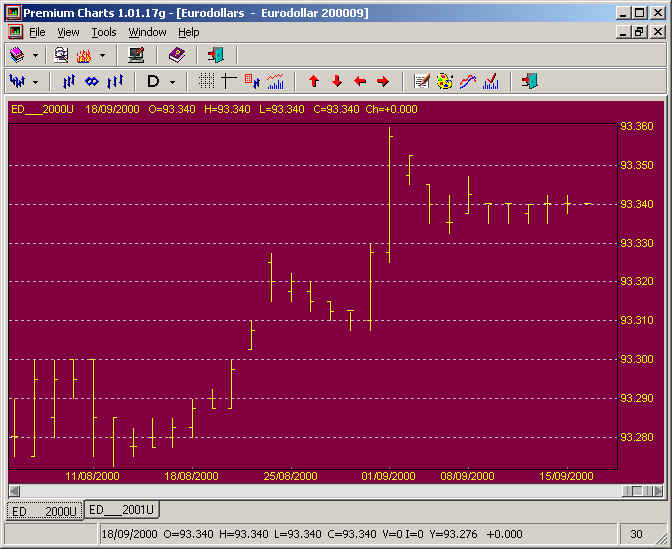
what happens to cash rates. Because of this, prices in different
delivery months can move in contrasting manner. For instance, prices in
the spot month may move quite sharply while back months remain relatively calm,
and
vice versa (see charts below). It is even possible for prices in one month to go up and in
another down, although this sort of divergence is most common in commodity futures markets,
where seasonal factors play a larger role. The assumption that all
delivery months are homogenous, which is implicit in the volume/open
interest algorithm, is mistaken, at least for most types of futures
markets. This is easily demonstrated if different roll schedules
are used to construct continuous contracts for the same market. The
variation in the results is often quite apparent to the naked eye. Some system traders are
happy for their continuous data to be "handed" to them by an
algorithm such as rolling on volume/open interest. Others prefer to
construct their own data and experiment with the results. Rolling on volume and/or
open interest is a good way to construct continuous contracts, as long as
the question of which delivery month appears in the series at any time is
not considered an issue.
Part 2 of the article looks
into a problem with simple "spliced" contracts and introduces
"back-adjusted" contracts.
Click on
Part 2 to continue.
Illustrations
1)
The
first chart below show the September 2000 Eurodollar contract trading
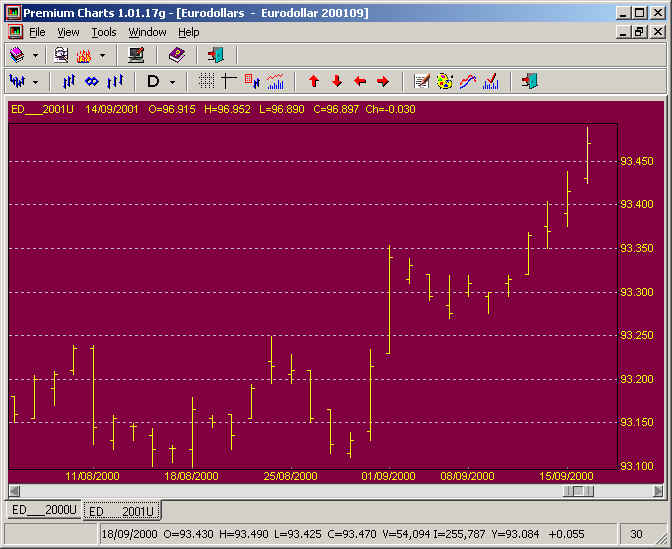
through a 9-point range in the final 30 days of its life. 2)
At the same
time, the September 2001 Eurodollar contract was trading through a
39-point range. 3) The table shows volume and open
interest in the September 2001 Silver contract falling away rapidly towards expiry.
Part 2 of the article looks
into a problem with simple "spliced" contracts and introduces
"back-adjusted" contracts.
Click on
Part 2 to continue.
|