Continuous Contracts Explained Part 2
The chart below shows two years of a spliced continuous contract for
Lean Hogs. The most obvious thing about the chart is that it tends to
consist of "clumps" of data separated by large gaps. What are
these gaps and where do they come from? 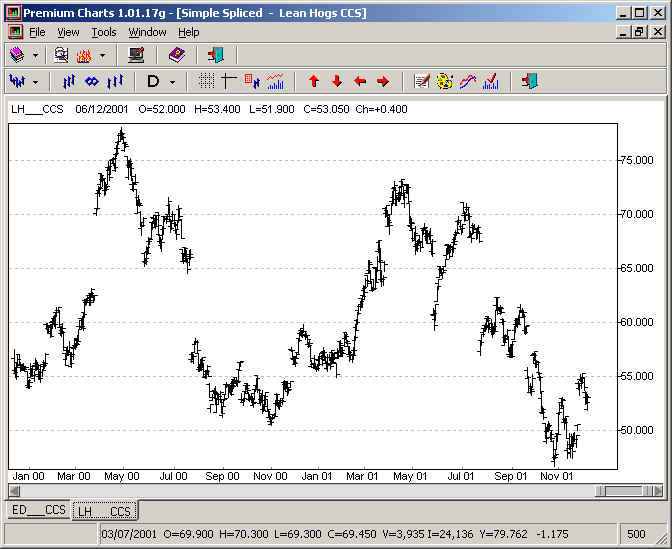
The
Problem with Simple "Spliced" Contracts
In Part 1
of this article, it was argued that the different contracts in a futures
market are not homogenous. Each delivery month points to where cash prices
might stand at a particular date in the future. Therefore each contract will tend to
trade at its own level. This leads to a problem when individual contracts
are spliced together. When one contract is replaced in the series by
another, the difference in price between the two will manifest itself as a
gap. This explains the gaps evident in the Lean Hogs chart above. For
instance, the first big gap in the chart, when prices appear to
"jump" from around 62.5 to 70 early in 2000, was caused by the
following sequence of events: 23/3/2000 - the April 2000 contract closes
at 62.525. It is now abandoned.
On the same day, the June 2000 contract closes at 69.950
24/3/2000 - the June 2000 contract, which is now the current
contract in the series, closes at 70.525. The spliced chart suggests
that the Lean Hogs market jumped about 7 basis points from the 23rd to the
24th. But the June contract itself jumped only 1.25 points. It was already
trading well above the level of April on the day that April was abandoned.
So when did the market jump those 7 points? The answer is that it never
did. The "market" is actually comprised of individual contracts
that run their own course. The spliced continuous contract attempts to
represent the longer-term history as best it can, but given the spurious
gaps that it creates, there are obvious limitations as to what a spliced
contract can achieve. What is a spliced contract good for? The
spliced contract offers a
"staccato" version of futures prices, with discontinuities
evident. Nevertheless, it can be used to identify where futures prices have
traded in the past. It paints the picture with a broad brush, but a
spliced chart can give a good idea of whether current futures prices are
high or low in an historical sense. What is it not good for? Any
numerical price indicator run on a spliced contract will reflect the
discontinuities inherent in the series. For instance, a moving average
will jump along with every gap. To the extent that an indicator is used to
assess market sentiment, it will provide a false reading, because the gaps
in a spliced contract are not caused by market activity. A spliced
contract will distort the testing of trading systems. Unless instructed
otherwise, a computerised system test based on a spliced contract will
incorporate the price gaps as evidence of profit or loss. What
is the solution? The answer is simple - take the gaps out!
The
Back-Adjusted Continuous Contract
In a
"gap-adjusted" continuous contract, every price gap caused by a
contract "roll" is measured and removed. The procedure can work
in either of two ways: it can start at the beginning of the series and
work its way forwards, removing each gap in turn, or it can start at the
end and work its way back. The "back-adjusting" method is
preferred, because it leaves current prices intact. Only those prices
prior to the last roll date are adjusted. So how is the
roll gap measured? The simplest way is to compare the closing prices on
the roll day. Using the example from above, we have: 23/3/2000 - June
Lean Hogs - 69.950
23/3/2000 - April Lean Hogs - 62.525
Roll gap = + 7.425 The roll gap is "up". How do we make it
disappear? We can't do it by magic. What we have to do is adjust all
previous prices up by 7.425 points. This effectively
"closes" the gap. Here is the back-adjustment algorithm in a
nutshell: working our way backwards, we measure every roll gap and adjust
all previous prices up or down according to whether the gap happens to be
positive or negative. The gaps are now eliminated. Of course, this
process never ends, a point that needs to be emphasized: every time a
new contract is added to the series, the back-adjusted contract is
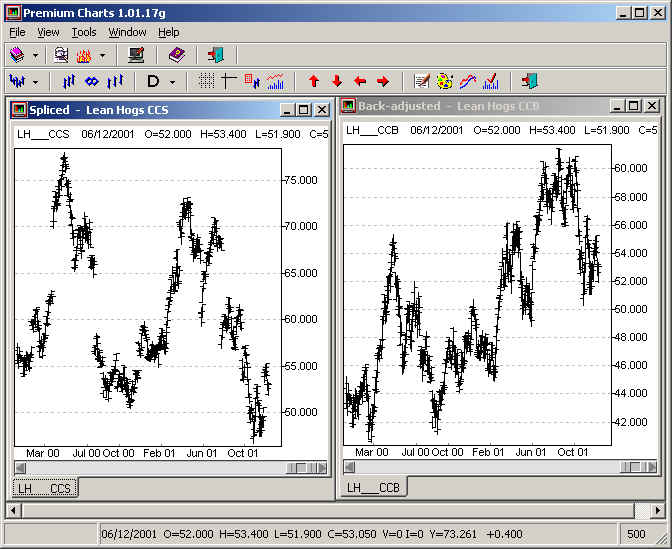
re-calculated and all previous prices are adjusted. Now let's have a look at the
result. The original spliced chart is shown on the left and the
back-adjusted version appears on the right.
Misconceptions about back-adjusted contracts Many
traders are happy to see spurious price gaps removed from their continuous
contracts but are unhappy with the result. They complain that the
back-adjusted prices are not "real", often citing the fact that
in some contracts the historical prices are actually negative. Traders looking for real
historical prices should consult their spliced charts. Prices in a
back-adjusted series are adjusted deliberately, so the complaint
about "unreal" prices misses the point. Gaps in a back-adjusted contract
disappear because historical prices are altered.
There is no other way to do it. Trading reality versus historical price reality If the prices in back-adjusted contracts are mostly
spurious, then of what use are they? To answer this question, let's
imagine that we enter a position in Lean Hogs on the first day in the
series and hold it to the end, rolling the position forward from one
delivery month to the next. If we ignore commission costs and execution
"slippage", the back-adjusted chart can be used to calculate the
exact value of the position at any time. Back-adjusted contracts represent
a different type of reality - trading reality. They show exactly
what would have happened to a trader who held a continuous position in any
market. Therefore back-adjusted contracts constitute the perfect resource for computerised system tests. Looking at the Lean Hogs charts
above, we can say that the broad price trend in the underlying commodity
has been down, but that the trend of trading activity in the futures
marketplace has been up. Spliced contracts may be
differentiated from back-adjusted contracts as follows:
-
Spliced contracts show price levels in a futures market. As a
drawback, they also display price movements that are spurious
(price gaps that are
unrelated to trading activity).
-
Back-adjusted contracts display price movements in a futures market that are due to trading
activity. As a drawback, they also show price levels that are spurious.
Is there a third way? The short answer is "no". If
roll gaps are left in a continuous contract, you have a
"spliced" chart. If roll gaps are removed entirely, you have a
"back-adjusted" chart. The only alternative is to remove the
gaps partially. The resulting series is caught between the other
two methods and marred by the disadvantages of both. Negative
numbers In futures markets that spend a large time in backwardation
(e.g. Crude Oil), the back-adjustment process can cause historical prices
to be pushed into negative territory. Some charting/analysis programs can
display negative numbers but can't do much else with them. This is not the
fault of the back-adjustment algorithm. Part 3 of the article looks
at how DataTools handles continuous contracts.
Click on
Part 3 to continue. |